
Introduction
A slow database can quickly become a slow application. SQL Server performance tuning helps you find the real bottleneck behind slow queries and improve database performance with measurable changes.
When SQL Server queries take longer than expected, users may experience:
- Slow web pages
- API timeouts
- Delayed reports
- High CPU utilization
- Increased database I/O
- Connection pool exhaustion
- Application timeouts
- Blocking
- Deadlocks
- Unexpected downtime
The difficult part is that “the database is slow” is not a root cause.
A database may appear slow because of a CPU-heavy query, excessive disk I/O, blocking, deadlocks, memory pressure, inefficient execution plans, or poorly optimized queries.
Effective SQL Server performance tuning starts by identifying the actual bottleneck and then making a measurable improvement.
In this guide, we’ll look at the most important techniques for finding and fixing slow SQL Server queries, including:
- CPU-heavy queries
- I/O-heavy queries
- Blocking
- Deadlocks
- Wait statistics
- Query Store
- Execution plans
- Index optimization
- Continuous performance monitoring
- Automated database performance analysis
Related SQL Server Performance Tuning Guides
For deeper troubleshooting, continue with these related SQL Server guides:
- SQL Server execution plans and performance bottlenecks
- How to design SQL Server indexes for better performance
- How to find and fix SQL Server blocking queries
- How to identify and fix SQL Server parameter sniffing
- SQL Server TempDB contention and PAGELATCH waits
- Common causes of slow database performance
Why Are SQL Server Queries Slow?
To fix a slow SQL Server query, first measure CPU, logical reads, duration, waits, and execution frequency. Then inspect the actual execution plan, blocking, indexes, statistics, and Query Store before making a targeted change and measuring the result.
There is no single reason why a SQL query becomes slow.
Common causes include:
Slow Query
   │
   ├── High CPU
   ├── High I/O
   ├── Missing Index
   ├── Poor Execution Plan
   ├── Blocking
   ├── Deadlock
   ├── Memory Pressure
   ├── Outdated Statistics
   ├── Parameter Sniffing
   └── Excessive Data Processing
The first step is therefore to determine what resource or database behavior is actually responsible for the delay.
1. Find CPU-Heavy Queries
CPU-heavy queries consume significant processor resources.
When SQL Server CPU usage becomes high, queries may start competing for available CPU time.
Common causes include:
- Complex JOINs
- Large aggregations
- Inefficient execution plans
- Missing indexes
- Excessive sorting
- Functions applied to columns
- Poor filtering
- Large scans
- Repeated execution of expensive queries
Find expensive queries
SQL Server provides Dynamic Management Views (DMVs) that can help identify queries with high CPU consumption.
For example:
SELECT TOP (20)
    qs.total_worker_time / 1000 AS TotalCPU_ms,
    qs.execution_count,
    qs.total_worker_time / NULLIF(qs.execution_count, 0) / 1000 AS AvgCPU_ms,
    qs.total_elapsed_time / NULLIF(qs.execution_count, 0) / 1000 AS AvgDuration_ms,
    qs.total_logical_reads,
    qs.total_logical_writes,
    st.text AS QueryText
FROM sys.dm_exec_query_stats qs
CROSS APPLY sys.dm_exec_sql_text(qs.sql_handle) st
ORDER BY qs.total_worker_time DESC;
This can help identify queries consuming significant CPU over the lifetime of the cached statistics.
What should you investigate?
For a CPU-heavy query, check:
- Actual execution plan
- Table and index scans
- JOIN operations
- Sort operations
- Aggregations
- Missing indexes
- Cardinality estimates
- Statistics
- Query frequency
A query consuming 500 ms of CPU but executing once may be less important than a 50 ms query executing 100,000 times.
That’s why CPU per execution and total CPU both matter.
2. Find I/O-Heavy Queries
CPU isn’t the only resource that can make SQL Server slow.
A query can also generate excessive logical or physical I/O.
For example:
SELECT *
FROM LargeOrders
WHERE CustomerId = 10025;
If the appropriate index doesn’t exist, SQL Server may need to examine a large portion of the table.
This can produce a significant number of logical reads.
Measure logical reads
You can use:
SET STATISTICS IO ON;

SELECT
    OrderId,
    CustomerId,
    OrderDate,
    TotalAmount
FROM Orders
WHERE CustomerId = 10025;

SET STATISTICS IO OFF;
SQL Server will report information about reads performed by the query.
High logical reads can indicate:
- Table scans
- Index scans
- Poor indexing
- Returning too much data
- Inefficient JOINs
- Missing filters
- Non-SARGable predicates
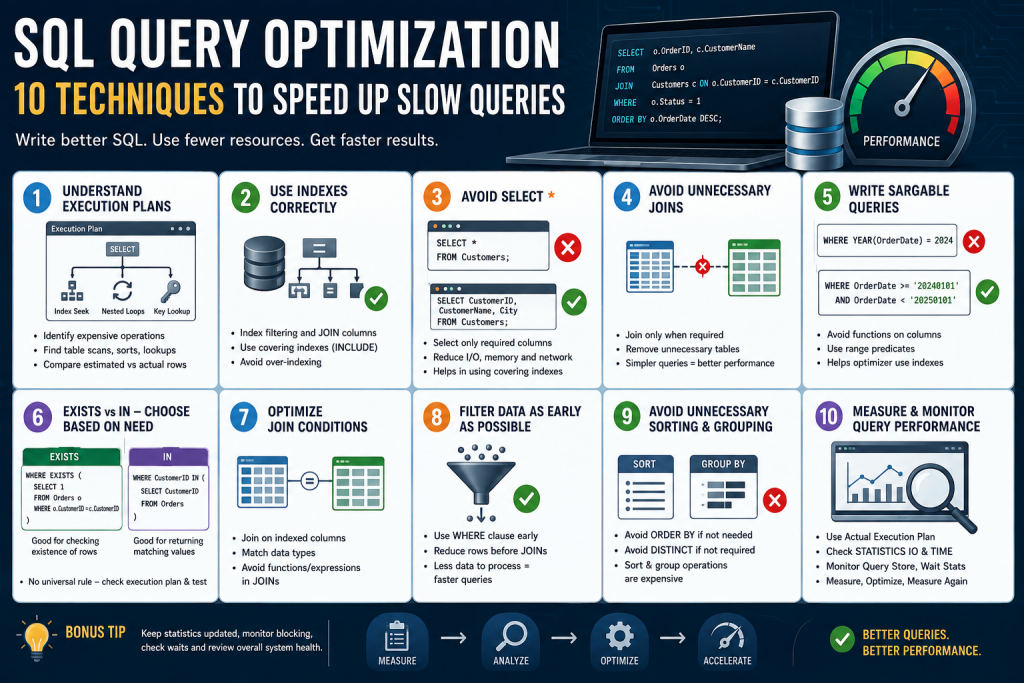
For example, instead of:
WHERE YEAR(OrderDate) = 2026
a range predicate may be more index-friendly:
WHERE OrderDate >= '20260101'
  AND OrderDate < '20270101'
The exact performance should always be validated with the actual execution plan and workload.
3. Understand Execution Plans
Execution plans are one of the most important tools for SQL Server performance tuning.
An execution plan shows how SQL Server processes a query.
Common operators include:
- Index Seek
- Index Scan
- Table Scan
- Key Lookup
- Nested Loops
- Hash Match
- Merge Join
- Sort
- Aggregate
For example:
SELECT
    CustomerId,
    CustomerName
FROM Customers
WHERE CustomerId = 1001;
If CustomerId has an appropriate index, SQL Server may perform an efficient index seek.
But a query that scans millions of rows may indicate an opportunity for optimization.
Important warning
Don’t assume:
Index Seek = always good
Index Scan = always bad
That’s an oversimplification.
For example, if a query needs most rows in a table, a scan may be more efficient than repeatedly seeking individual rows.
The correct question is:
Is the execution plan appropriate for the amount and type of data the query needs?
4. Identify SQL Server Blocking
Blocking occurs when one session holds a lock that another session needs.
For example:
Session 101
    │
    └── Holds lock
          │
          ▼
       Orders table
          │
          └────────► Session 205 waits
The waiting session cannot continue until the required resource becomes available.
Blocking can cause:
- Slow queries
- API timeouts
- Long-running transactions
- Connection pool exhaustion
- Poor application performance
Common causes of blocking
Blocking may be caused by:
- Long-running transactions
- Large UPDATE statements
- Large DELETE statements
- Transactions left open
- Missing indexes
- Poor transaction design
- High concurrency
- Inefficient queries
Important
Blocking isn’t automatically a problem.
Short periods of normal blocking are expected in many transactional systems.
The problem is excessive or prolonged blocking that materially affects workload performance.
5. Find Blocking Sessions
SQL Server provides DMVs that can help identify waiting sessions.
A basic query is:
SELECT
    r.session_id,
    r.status,
    r.blocking_session_id,
    r.wait_type,
    r.wait_time,
    r.cpu_time,
    r.total_elapsed_time,
    r.logical_reads,
    t.text AS QueryText
FROM sys.dm_exec_requests r
CROSS APPLY sys.dm_exec_sql_text(r.sql_handle) t
WHERE r.blocking_session_id <> 0;
This can help answer:
- Who is waiting?
- Who is blocking?
- What is the wait type?
- How long has the request been waiting?
- What query is involved?
The next step is to investigate the root blocking session, not just the session that happens to be waiting.
6. Understand Deadlocks
A deadlock is different from ordinary blocking.
In a deadlock, two or more transactions wait for resources held by each other.
For example:
Transaction A
     │
     ├── Locks Table A
     │
     └── Waits for Table B
                 ▲
                 │
Transaction B    │
     │           │
     ├── Locks Table B
     │
     └── Waits for Table A
Neither transaction can continue.
SQL Server detects the deadlock and chooses one transaction as the deadlock victim.
The victim transaction is rolled back so the other transaction can proceed.
Common deadlock causes
- Inconsistent access order
- Long transactions
- Large transactions
- Missing indexes
- Excessive locking
- Poor transaction design
- High concurrency
- Different queries accessing resources in different orders
7. How to Reduce Deadlocks
There isn’t one universal fix for deadlocks.
Useful strategies include:
Access objects in a consistent order
For example, if one transaction updates:
Customers → Orders
another transaction should ideally follow the same logical order instead of:
Orders → Customers
Keep transactions short
Avoid unnecessary work inside transactions.
Optimize queries
A query that takes 10 seconds while holding locks can create significantly more contention than one that takes 100 ms.
Use appropriate indexes
Better indexes can reduce the amount of data SQL Server needs to examine and lock.
Capture deadlock information
SQL Server Extended Events can capture deadlock graphs and help identify the actual resources involved.
8. Understand Wait Statistics
One of the best ways to understand SQL Server performance problems is to analyze wait statistics.
A wait tells you that a SQL Server worker could not continue immediately because it was waiting for something.
Examples include waits related to:
- CPU scheduling
- Locks
- I/O
- Memory
- Parallelism
- Network communication
- Log flushes
- Synchronization
Wait statistics can help answer:
What is SQL Server spending time waiting for?
This is often more useful than simply looking at CPU utilization.
For example:
High CPU
     ↓
Investigate CPU-heavy queries

High I/O waits
     ↓
Investigate storage and read-heavy queries

Lock waits
     ↓
Investigate blocking and transactions

Log-related waits
     ↓
Investigate transaction/log throughput

Memory-related waits
     ↓
Investigate memory pressure
The exact meaning of a wait type should always be interpreted in context.
9. Use Query Store
Query Store is one of the most useful SQL Server features for query performance troubleshooting.
It captures query-related performance information over time, allowing you to investigate how queries behave across different periods.
Query Store can help you identify:
- Slow queries
- Frequently executed queries
- High CPU queries
- High-duration queries
- High-read queries
- Plan changes
- Query regressions
- Historical performance trends
This is particularly useful because a query may not be slow all the time.
For example:
Monday
Query: 80 ms

Tuesday
Query: 95 ms

Wednesday
Query: 120 ms

Thursday
Query: 3,800 ms
Something changed.
Perhaps:
- A different execution plan was selected
- Data distribution changed
- Statistics changed
- The database grew
- An index was modified
- The workload changed
Query Store can help you investigate these changes.
10. Detect Query Regressions
One of the most frustrating database problems occurs when a query that was previously fast suddenly becomes slow.
For example:
Before:
Query Duration = 100 ms

After:
Query Duration = 4,500 ms
The SQL text may not have changed.
The execution plan may have changed.
This is called a query performance regression.
Query Store can help identify plan changes and compare performance across time.
When investigating a regression, examine:
- Previous execution plan
- Current execution plan
- Query statistics
- Data changes
- Statistics updates
- Index changes
- Parameter behavior
- Server resource pressure
11. Check Parameter Sniffing
Parameter sniffing can cause a query to perform well for one parameter value but poorly for another.
Consider:
CREATE PROCEDURE GetOrders
    @CustomerId INT
AS
BEGIN
    SELECT
        OrderId,
        OrderDate,
        TotalAmount
    FROM Orders
    WHERE CustomerId = @CustomerId;
END
Suppose one customer has:
10 orders
while another has:
5,000,000 orders
An execution plan that works well for one parameter value may not be optimal for another.
This can create inconsistent query performance.
Potential approaches depend on the workload and SQL Server version, and may include:
- Query/index redesign
- Updated statistics
- Query Store plan forcing where appropriate
OPTION (RECOMPILE)for specific scenariosOPTIMIZE FOR- Query rewriting
These techniques should be applied carefully because each has trade-offs.
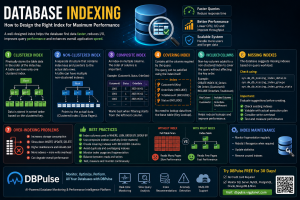
12. Optimize Indexes
Indexes can dramatically improve query performance, but only when designed around actual workload.
Consider:
SELECT
    OrderId,
    OrderDate,
    TotalAmount
FROM Orders
WHERE CustomerId = 1001
  AND Status = 1;
A composite index may help:
CREATE INDEX IX_Orders_Customer_Status
ON Orders
(
    CustomerId,
    Status
)
INCLUDE
(
    OrderDate,
    TotalAmount
);
This can potentially reduce:
- Logical reads
- Key lookups
- CPU
- Query duration
But adding indexes blindly can also make INSERT, UPDATE, and DELETE operations more expensive.
Always validate index changes using the actual workload.
13. Measure CPU, I/O and Duration Together
A common mistake is to focus on only one metric.
Suppose:
Query A
CPU:       5 seconds
Reads:     10,000
Duration:  6 seconds
and:
Query B
CPU:       100 ms
Reads:     20 million
Duration:  8 seconds
Both are performance problems, but for different reasons.
Query A is CPU-heavy.
Query B is potentially I/O-heavy.
Therefore, good performance analysis considers multiple dimensions:
CPU
│
├── Total CPU
├── CPU per execution
│
I/O
│
├── Logical reads
├── Logical writes
│
Duration
│
├── Total duration
├── Average duration
│
Concurrency
│
├── Blocking
├── Deadlocks
├── Waits
14. Use SET STATISTICS TIME
You can measure CPU and elapsed time using:
SET STATISTICS TIME ON;

SELECT
    CustomerId,
    COUNT(*) AS OrderCount
FROM Orders
GROUP BY CustomerId;

SET STATISTICS TIME OFF;
This provides useful information about CPU time and elapsed time.
You can compare the query before and after optimization.
For example:
Before
CPU Time:      2,100 ms
Elapsed Time:  2,700 ms

After
CPU Time:        420 ms
Elapsed Time:    510 ms
Now you have measurable evidence that the optimization improved performance.
15. Don’t Forget Statistics
SQL Server’s optimizer relies on statistics to estimate how many rows a query will return.
If those estimates are significantly wrong, SQL Server may choose an inefficient execution plan.
Problems can occur when:
- Data distribution changes
- Tables grow significantly
- Statistics become stale
- Highly skewed data is involved
Therefore, when troubleshooting a slow query, don’t look only at indexes.
Also investigate:
Indexes
+
Statistics
+
Execution Plan
+
Query Shape
+
Data Distribution
16. Continuous Database Monitoring Is Better Than Occasional Troubleshooting
Traditional troubleshooting often looks like this:
User reports problem
        ↓
Developer investigates
        ↓
DBA checks database
        ↓
Find slow query
        ↓
Fix problem
The problem is that you may only discover the issue after users are already affected.
A modern approach is:
Continuous Monitoring
        ↓
Performance Detection
        ↓
Anomaly Detection
        ↓
Root Cause Analysis
        ↓
Optimization Recommendation
        ↓
Validation
This allows teams to identify performance problems earlier.
DBPulse: Monitor and Optimize Your Databases
If you’re managing production databases, manually checking DMVs, execution plans, blocking, deadlocks, waits, and slow queries can become time-consuming.
DBPulse is an AI-powered database monitoring and performance platform that brings database health, query performance, anomaly detection, lock waits, capacity risks, and optimization insights into a unified monitoring experience. Its official site currently advertises support for SQL, NoSQL, cloud, and hybrid environments, along with real-time query performance analysis and AI-based anomaly detection.
DBPulse’s workflow is built around:
Connect → Discover → Analyze → Optimize
The platform says it can automatically discover database instances and analyze metrics, logs, and traces, while highlighting slow queries, anomalies, lock waits, and capacity risks.
What can you monitor?
With a database monitoring platform such as DBPulse, you can bring together:
- Query performance
- CPU utilization
- Database workload
- Query latency
- Lock waits
- Deadlocks
- Anomalies
- Capacity risks
- Index optimization opportunities
- Performance trends
DBPulse also advertises monitoring across SQL, NoSQL, Oracle, PostgreSQL, MySQL, and hybrid environments.
Why use DBPulse?
Instead of manually asking:
“Which query is making my SQL Server slow?”
you can use a centralized performance dashboard to investigate:
Which database, query, resource, or workload changed—and why?
Try DBPulse — Start Free Trial
The official DBPulse site currently advertises a 30-day free trial with no credit card required.
SQL Server Performance Tuning Workflow
A practical workflow looks like this:
Step 1 — Detect
Find queries with:
- High CPU
- High duration
- High logical reads
- High execution frequency
Step 2 — Diagnose
Check:
- Execution plan
- Blocking
- Deadlocks
- Wait statistics
- Query Store
- Indexes
- Statistics
Step 3 — Optimize
Potential solutions include:
- Query rewriting
- Index optimization
- Statistics maintenance
- Transaction optimization
- JOIN optimization
- Reducing unnecessary data
- Addressing blocking
- Investigating plan regressions
Step 4 — Validate
Measure:
- CPU
- Logical reads
- Duration
- Wait time
- Throughput
Step 5 — Monitor
Continue monitoring after the fix.
A query that is fast today can become slow tomorrow as the database grows.
SQL Server Performance Tuning Checklist
- Identify top CPU-consuming queries
- Identify high-I/O queries
- Check query duration
- Review actual execution plans
- Check for table scans
- Check for expensive key lookups
- Review indexes
- Check statistics
- Investigate blocking
- Investigate deadlocks
- Analyze wait statistics
- Review Query Store
- Check for query plan regressions
- Investigate parameter sniffing
- Optimize expensive JOINs
- Measure before and after
- Continue monitoring after optimization
Frequently Asked Questions
How do I find slow queries in SQL Server?
Use Query Store, DMVs, execution plans, Extended Events, and monitoring tools to identify queries with high CPU, duration, logical reads, or execution frequency.
What causes high CPU in SQL Server?
Common causes include inefficient queries, large scans, expensive JOINs, sorting, aggregations, poor execution plans, and high query execution frequency.
What causes high SQL Server I/O?
High I/O can be caused by table scans, index scans, inefficient queries, missing indexes, excessive data retrieval, and poorly selective predicates.
What is SQL Server blocking?
Blocking occurs when one session holds a lock or resource that another session needs, causing the second session to wait.
What is a SQL Server deadlock?
A deadlock occurs when two or more transactions are waiting for resources held by each other. SQL Server detects the cycle and chooses one transaction as the deadlock victim.
What are SQL Server wait statistics?
Wait statistics provide information about what SQL Server sessions are waiting for, helping DBAs identify resource and concurrency bottlenecks.
What is Query Store?
Query Store is a SQL Server feature that stores query performance and execution-plan information over time, making it useful for identifying performance trends and regressions.
Is an index always the solution to a slow query?
No. A slow query can be caused by CPU pressure, I/O, blocking, deadlocks, poor query design, statistics, execution plans, parameter sensitivity, or other resource bottlenecks.
Conclusion
SQL Server performance tuning is not simply about finding one slow query and adding an index.
Effective performance tuning requires understanding the complete database workload.
When a query is slow, investigate:
CPU → I/O → Execution Plan → Indexes → Blocking → Deadlocks → Waits → Query Store → Statistics
Complete SQL Server Performance Tuning Guide
Then make a targeted change and measure the result.
The most important principle is:
Don’t guess why SQL Server is slow. Measure the workload, identify the bottleneck, optimize it, and monitor the result.
For teams managing production databases, continuous monitoring can make this process much easier.
DBPulse provides a unified database monitoring and performance platform with real-time query performance analysis, AI-based anomaly detection, lock-wait visibility, capacity-risk analysis, and optimization-oriented insights.
Explore DBPulse and Start the Free Trial
Find the problem. Understand the cause. Optimize the database. Keep monitoring.