

A database can start fast and become slow over time.
An application that once responded in milliseconds may eventually take seconds to load. APIs may start timing out, reports may take much longer to generate, and users may complain that the entire application feels slow.
But what actually makes a database slow?
The answer is rarely just one thing.
Database performance can be affected by:
- Poor execution plans
- Missing or inappropriate indexes
- Fragmented indexes
- Outdated statistics
- Blocking
- Deadlocks
- Memory pressure
- TempDB problems
- Excessive disk I/O
- CPU pressure
- Poor database design
- Inefficient queries
- Large transactions
- Configuration issues
- Database growth
The important point is that database performance optimization is a continuous process, not a one-time activity.
In this article, we’ll explore 15 common reasons databases become slow and explain how to identify and fix each problem.
1. Bad Execution Plans
The SQL Server query optimizer chooses an execution plan based on the query, indexes, statistics, available resources, and estimated data distribution.
Sometimes the selected plan is not optimal for the current workload.
For example, a query might use:
Table Scanwhen an efficient index access could significantly reduce the amount of data processed.
Other expensive operators can include:
- Key Lookup
- Sort
- Hash Match
- Nested Loops
- Large scans
- Excessive parallelism
How to identify the problem
Use:
- Actual Execution Plans
- Query Store
- DMVs
- Extended Events
- Database monitoring tools
Look for queries with:
- High CPU
- High logical reads
- Long execution duration
- Large estimated-vs-actual row differences
- Plan changes
How to fix it
Depending on the cause, solutions may include:
- Query optimization
- Index optimization
- Statistics updates
- Query Store plan analysis
- Query rewriting
- Addressing parameter sensitivity
- Removing unnecessary operations
Don’t assume that the most expensive-looking operator is automatically the problem. Analyze the entire execution plan and workload.
2. Fragmented Indexes
As data is inserted, updated, and deleted, index pages can become fragmented.
Fragmentation can increase the amount of work required for certain access patterns, particularly range scans.
SQL Server provides tools for examining index fragmentation.
For example:
SELECT
    OBJECT_NAME(object_id) AS TableName,
    index_id,
    avg_fragmentation_in_percent,
    page_count
FROM sys.dm_db_index_physical_stats
(
    DB_ID(),
    NULL,
    NULL,
    NULL,
    'LIMITED'
)
WHERE index_id > 0;
Should every fragmented index be rebuilt?
No.
A small index with high fragmentation may have little practical impact.
Index maintenance should consider:
- Fragmentation percentage
- Number of pages
- Query workload
- Maintenance cost
- Available maintenance window
Depending on the situation, you may use:
ALTER INDEX ...
REORGANIZE;
or:
ALTER INDEX ...
REBUILD;
The correct choice depends on the workload and operational requirements.
3. Outdated Statistics
SQL Server uses statistics to estimate how many rows a query will return.
Those estimates influence the execution plan.
If statistics don’t accurately represent the current data distribution, SQL Server may choose an inefficient plan.
For example:
Estimated Rows: 100
Actual Rows:    2,000,000
That is a significant estimation error.
It can result in poor choices involving:
- Join algorithms
- Memory grants
- Index access
- Parallelism
- Sorting
- Hash operations
How to improve statistics
Depending on the situation:
UPDATE STATISTICS dbo.Orders;or:
EXEC sp_updatestats;However, don’t blindly update every statistic constantly.
Investigate whether statistics are actually contributing to the performance problem.
4. Blocking
Blocking occurs when one database session holds a resource that another session needs.
For example:
Transaction A
     │
     ├── Holds lock
     │
     ▼
 Orders Table
     │
     └────────────► Transaction B waits
Blocking is normal in transactional systems to some extent.
The problem is long-running or excessive blocking.
Common causes include:
- Long transactions
- Large updates
- Large deletes
- Open transactions
- Missing indexes
- Poor transaction design
- High concurrency
Find blocking
A basic SQL Server query:
SELECT
    session_id,
    blocking_session_id,
    wait_type,
    wait_time,
    cpu_time,
    total_elapsed_time
FROM sys.dm_exec_requests
WHERE blocking_session_id <> 0;
Don’t just kill the blocked session.
First identify the root blocker and understand why it is holding the resource.
5. Deadlocks
A deadlock occurs when transactions wait for resources held by each other.
For example:
Transaction A
    ↓
Locks Customer
    ↓
Waits for Order

Transaction B
    ↓
Locks Order
    ↓
Waits for Customer
Neither can proceed.
SQL Server detects the deadlock and terminates one transaction as the victim.
Common causes
- Inconsistent table access order
- Long transactions
- Missing indexes
- Large transactions
- High concurrency
- Excessive locking
- Poor application transaction design
How to reduce deadlocks
Consider:
- Keeping transactions short
- Accessing tables in a consistent order
- Optimizing queries
- Adding appropriate indexes
- Reducing unnecessary locking
- Capturing deadlock graphs
Deadlocks should be analyzed rather than simply treating the victim error.
6. Memory Pressure
SQL Server uses memory extensively for:
- Data pages
- Execution plans
- Query execution
- Sort operations
- Hash operations
- Caches
When available memory is insufficient, database performance can suffer.
Memory pressure may result in:
- More physical reads
- Reduced cache efficiency
- Query performance degradation
- Larger wait times
- Memory grant problems
What should you investigate?
Check:
- SQL Server memory configuration
- Available system memory
- Buffer cache behavior
- Memory grants
- Expensive queries
- Other applications consuming server memory
A database server should be analyzed as a complete system rather than assuming SQL Server is always the only consumer of memory.
7. TempDB Problems
TempDB is used for many SQL Server operations, including:
- Temporary tables
- Table variables
- Sorting
- Hash operations
- Version stores
- Intermediate query results
- Certain index operations
If TempDB becomes a bottleneck, many unrelated queries can experience performance problems.
Common TempDB problems
- Poor storage performance
- Insufficient files
- File growth events
- Version-store pressure
- Heavy temporary-object usage
- Long-running transactions
- Excessive spills
Monitor TempDB
Look at:
- Data-file usage
- Log usage
- Growth events
- Version store
- Allocation contention
- I/O latency
TempDB should be treated as a critical component of SQL Server performance.
8. Excessive Disk I/O
Disk I/O is another common source of database performance problems.
A query may generate millions of logical reads because of:
- Table scans
- Index scans
- Poor filtering
- Missing indexes
- Large result sets
- Inefficient joins
Physical disk latency can make the problem even worse.
Measure logical reads
Use:
SET STATISTICS IO ON;

SELECT *
FROM Orders
WHERE CustomerId = 1001;

SET STATISTICS IO OFF;
High logical reads don’t automatically mean the storage subsystem is slow.
They can indicate that the query is simply processing too much data.
Therefore, distinguish between:
Query-generated I/O
and
Storage-system latency.
Both require different solutions.
9. CPU Pressure
A database server can become slow because the CPU is saturated.
Common causes include:
- CPU-intensive queries
- Large scans
- Complex calculations
- Sorting
- Aggregation
- Excessive parallelism
- High query concurrency
- Poor execution plans
Find queries with high CPU consumption using DMVs and Query Store.
For example:
SELECT TOP (20)
    qs.total_worker_time / 1000 AS TotalCPU_ms,
    qs.execution_count,
    qs.total_worker_time /
        NULLIF(qs.execution_count, 0) / 1000 AS AvgCPU_ms,
    st.text AS QueryText
FROM sys.dm_exec_query_stats qs
CROSS APPLY sys.dm_exec_sql_text(qs.sql_handle) st
ORDER BY qs.total_worker_time DESC;
The goal isn’t simply to reduce CPU.
The goal is to understand why the CPU is being consumed.
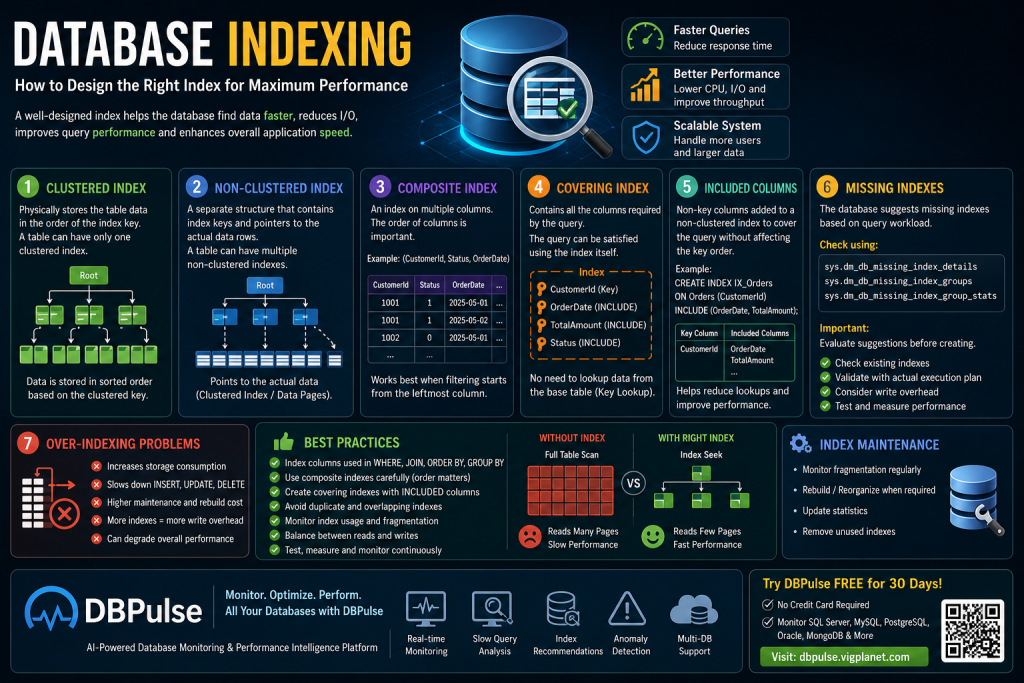
10. Missing or Poorly Designed Indexes
Indexes can dramatically improve query performance.
Consider:
SELECT
    OrderId,
    OrderDate,
    TotalAmount
FROM Orders
WHERE CustomerId = 1001;
If the table contains millions of rows and there is no useful access path, SQL Server may need to process many rows.
An index such as:
CREATE INDEX IX_Orders_CustomerId
ON Orders(CustomerId)
INCLUDE(OrderDate, TotalAmount);
may help this workload.
But indexes should not be created blindly.
Too many indexes can make:
INSERT
UPDATE
DELETE
more expensive.
Index design should be based on:
- Query patterns
- Execution plans
- Data distribution
- Index usage
- Read/write workload
11. Poor Database Design
Sometimes the performance problem isn’t the query.
It’s the underlying database design.
Examples include:
- Incorrect data types
- Excessively wide tables
- Poor normalization decisions
- Missing relationships
- Incorrect primary keys
- Repeated data
- Unnecessary nullable columns
- Large unstructured fields
- Poor partitioning strategy
- Inappropriate indexing strategy
For example, storing numeric values as:
VARCHARwhen they should be numeric can create unnecessary conversion and comparison issues.
Similarly, using:
VARCHAR(MAX)for every text column can increase storage and processing overhead when shorter data types would be sufficient.
Good database design provides a foundation for good performance.
12. Inefficient SQL Queries
Sometimes the database infrastructure is healthy, but the query itself is inefficient.
Common examples:
SELECT *
SELECT *
FROM Customers;
If only three columns are required, retrieve those three columns.
Functions on indexed columns
Instead of:
WHERE YEAR(OrderDate) = 2026consider:
WHERE OrderDate >= '20260101'
AND OrderDate < '20270101'
Unnecessary DISTINCT
SELECT DISTINCT ...can introduce additional sorting or hashing work.
Unnecessary JOINs
Don’t join tables unless the relationship is required for the result or filtering logic.
Small query improvements can produce significant results when a query runs thousands or millions of times.
13. Large Transactions
Large transactions can create several performance problems.
For example:
BEGIN TRANSACTION;

UPDATE Orders
SET Status = 2;

-- Millions of rows

COMMIT;
This may generate:
- Long lock durations
- Large transaction logs
- Blocking
- Increased rollback time
- Increased I/O
For large data operations, consider whether the workload can be safely processed in smaller batches.
For example:
1,000,000 rows
      ↓
Batch 1 → 10,000
Batch 2 → 10,000
Batch 3 → 10,000
...
Batching must be designed carefully because the correct approach depends on transactional requirements and business rules.
14. Excessive Connection and Query Concurrency
A database can also become slow when too many requests arrive simultaneously.
Imagine:
Application
   │
   ├── Request 1
   ├── Request 2
   ├── Request 3
   ├── Request 4
   ├── ...
   └── Request 10,000
          ↓
      SQL Server
Even individually efficient queries can create problems when thousands execute concurrently.
This can increase:
- CPU pressure
- Memory usage
- Lock contention
- I/O
- Worker-thread pressure
- Connection pool pressure
Performance tuning therefore needs to consider both:
Query efficiency
and
Workload concurrency.
15. Lack of Continuous Database Monitoring
One of the biggest database-performance problems isn’t a technical configuration.
It’s not knowing what changed.
A database can perform well at 10 AM and become slow at 2 PM.
A query that normally takes:
100 msmay suddenly take:
5,000 msThe reason could be:
- A plan change
- Increased workload
- Database growth
- Blocking
- Deadlock
- CPU pressure
- I/O latency
- Statistics changes
- New application deployment
- Increased concurrency
Without historical monitoring, finding the root cause can take much longer.
This is why modern database environments need continuous performance monitoring.
How to Troubleshoot a Slow Database
When users report:
“The application is slow.”
Don’t immediately restart SQL Server or rebuild every index.
Follow a structured process.
Step 1: Check Current Health
Look at:
- CPU
- Memory
- Disk I/O
- Database connections
- Active requests
- Blocking
- Waits
Step 2: Find Expensive Queries
Look for:
- High CPU
- High duration
- High logical reads
- High execution frequency
Step 3: Check Execution Plans
Look for:
- Scans
- Lookups
- Sorts
- Hash operations
- Poor cardinality estimates
Step 4: Check Indexes
Review:
- Missing indexes
- Duplicate indexes
- Fragmentation
- Index usage
- Composite index design
Step 5: Check Concurrency
Investigate:
- Blocking
- Deadlocks
- Long transactions
- Lock waits
Step 6: Check System Resources
Investigate:
- CPU
- Memory
- Storage latency
- TempDB
- Transaction log
Step 7: Compare With Historical Data
Ask:
What changed?
This question can often lead you to the root cause faster than looking at the current state alone.
DBPulse: Database Monitoring and Performance Intelligence
Managing all these performance metrics manually can be difficult, especially when you have multiple production databases.
This is where DBPulse can help.
DBPulse — Database Monitoring & Performance Intelligence is designed to provide a centralized view of database health, performance, slow queries, anomalies, and optimization opportunities.
Instead of manually checking multiple tools and DMVs, DBPulse brings important database performance signals together in one place.
DBPulse can help you monitor:
- Database health
- Slow queries
- CPU utilization
- Query performance
- I/O activity
- Lock waits
- Blocking
- Deadlocks
- Performance anomalies
- Capacity risks
- Query trends
- Index optimization opportunities
The goal is simple:
Detect → Analyze → Optimize → Monitor
Why Continuous Database Monitoring Matters
Consider a production database with 500 tables and thousands of queries.
A DBA cannot manually inspect every query every minute.
A monitoring platform can continuously analyze performance signals and highlight unusual behavior.
For example:
Normal Query
    ↓
120 ms average

Sudden change
    ↓
2,800 ms

Monitoring detects anomaly
    ↓
Investigate execution plan
    ↓
Check CPU / I/O / waits
    ↓
Check blocking
    ↓
Identify root cause
    ↓
Optimize
This approach can reduce the time required to identify database performance problems.
DBPulse for Developers, DBAs and DevOps Teams
Database performance isn’t only a DBA responsibility.
Developers
Can identify slow queries and optimize application database calls.
DBAs
Can monitor database health, queries, blocking, waits, and resource utilization.
DevOps / SRE
Can monitor database performance as part of the overall application infrastructure.
Engineering Managers
Can get a higher-level view of database health and performance trends.
A centralized monitoring platform helps each team work from the same performance information.
Database Performance Optimization Checklist
Use this checklist when troubleshooting a slow SQL Server database:
- Check CPU utilization
- Check memory pressure
- Check disk I/O
- Check I/O latency
- Check TempDB
- Find CPU-heavy queries
- Find I/O-heavy queries
- Review execution plans
- Check Query Store
- Check statistics
- Check index fragmentation
- Check missing indexes
- Review duplicate indexes
- Check blocking
- Check deadlocks
- Check long-running transactions
- Review database design
- Check query concurrency
- Compare current performance with historical data
- Monitor after optimization
Frequently Asked Questions
Why is my SQL Server database slow?
A SQL Server database can become slow because of inefficient queries, bad execution plans, missing indexes, outdated statistics, blocking, deadlocks, memory pressure, TempDB problems, disk I/O, CPU pressure, or poor database design.
How do I find what is making SQL Server slow?
Start with CPU, I/O, waits, active requests, blocking, Query Store, execution plans, and expensive queries. Historical performance data can also help identify what changed.
Can rebuilding indexes fix a slow database?
Sometimes, but not always. Index fragmentation is only one possible cause of poor performance. Rebuilding indexes without identifying the actual bottleneck can waste resources.
How does blocking affect database performance?
Blocking causes one session to wait for another session’s locked resources. Excessive or prolonged blocking can cause queries and applications to become slow.
What is TempDB used for?
TempDB supports temporary objects, sorting, hashing, version stores, intermediate operations, and other internal SQL Server activities. TempDB problems can therefore affect many queries.
Can too many indexes slow down SQL Server?
Yes. Indexes can improve reads but also increase storage requirements and the cost of INSERT, UPDATE, and DELETE operations.
How often should database performance be monitored?
Production databases should ideally be monitored continuously or at least frequently enough to detect performance changes before they become major incidents.
Conclusion
Database performance optimization is not about applying one magic fix.
A slow database can be caused by a combination of:
Execution plans + indexes + statistics + CPU + memory + I/O + TempDB + blocking + transactions + database design + workload concurrency.
The most effective approach is systematic:
Measure → Identify → Diagnose → Optimize → Validate → Monitor
Start with the evidence.
Find the expensive queries.
Understand the execution plans.
Investigate CPU, I/O, waits, blocking, and deadlocks.
Review indexes and statistics.
Then make targeted changes and measure the results.
Most importantly, continue monitoring after the optimization.
Because database performance changes as your application, data, and workload grow.
For teams that want centralized database visibility, DBPulse provides database monitoring and performance intelligence to help identify slow queries, anomalies, resource problems, and optimization opportunities.
Don’t wait for users to report that your database is slow. Monitor it, detect problems early, and optimize with data.
DBPulse — Monitor. Analyze. Optimize. Perform


3 thoughts on “Database Performance Optimization: 15 Common Reasons Your Database Is Slow”