

When a SQL Server application becomes slow, one of the first questions should be:
What is SQL Server actually doing to execute this query?
SQL Server performance tuning is the process of finding the causes of slow queries and improving database performance using evidence from execution plans, query metrics, indexes, statistics, waits, blocking, and workload behavior. An execution plan is one of the most useful starting points because it shows how SQL Server chose to retrieve and process the requested data.
Looking only at the SQL statement often isn’t enough.
Two queries that look simple can have completely different execution strategies depending on:
- Table size
- Indexes
- Statistics
- Data distribution
- Join conditions
- Filtering
- Parameter values
- Query optimizer decisions
This is where the SQL Server execution plan becomes one of the most valuable tools for performance tuning.
An execution plan shows the operations SQL Server uses to retrieve and process data. By learning to read these plans, you can identify problems such as:
- Table scans
- Inefficient index usage
- Key lookups
- Expensive joins
- Hash operations
- Sort operations
- Incorrect row estimates
- Excessive I/O
- Poor query plans
In this guide, we’ll explain the most important execution-plan operators and show how to use them to identify SQL Server performance bottlenecks.
What Is a SQL Server Execution Plan in SQL Server Performance Tuning?
An execution plan is the roadmap SQL Server uses to execute a query.
Consider:
SELECT
    CustomerId,
    CustomerName
FROM Customers
WHERE City = 'Jaipur';
SQL Server’s optimizer evaluates the query and decides how to retrieve the required data.
It may choose:
Query
  ↓
Index Seek
  ↓
Filter
  ↓
Result
or, if no useful index exists:
Query
  ↓
Table Scan
  ↓
Filter
  ↓
Result
The query text may be almost identical, but the amount of work performed can be dramatically different.
Estimated vs Actual Execution Plans
SQL Server provides two important types of execution plans.
Estimated Execution Plan
An estimated execution plan shows what SQL Server expects to happen before the query executes.
It can help you understand:
- Expected row counts
- Chosen operators
- Estimated costs
- Join strategies
- Index usage
Actual Execution Plan
The actual execution plan is generated after the query runs and contains runtime information.
It can show:
- Actual row counts
- Actual execution details
- Runtime operators
- Warnings
- Actual execution behavior
The difference between estimated and actual rows can be extremely useful.
For example:
Estimated Rows: 100
Actual Rows:    500,000
That is a major estimation difference and may indicate issues involving:
- Statistics
- Data distribution
- Predicates
- Parameter sensitivity
- Query design
Important rule
When troubleshooting an existing performance problem, the actual execution plan is often particularly valuable because it shows what happened during execution rather than only what SQL Server expected to happen.
How to Open an Execution Plan in SQL Server Management Studio
In SQL Server Management Studio (SSMS), you can enable the actual execution plan before running a query.
The common shortcut is:
Ctrl + M
Then execute your query.
Alternatively, use the SSMS menu to enable the actual execution plan.
For an estimated plan, you can use:
Ctrl + L
This allows you to inspect the plan without executing the query.
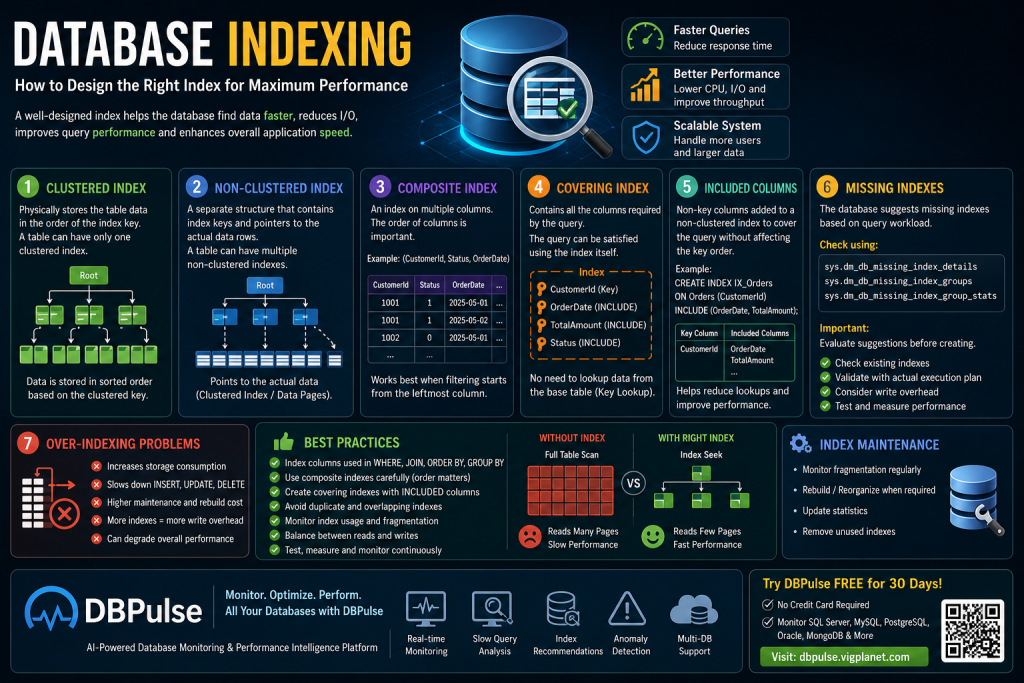
1. Table Scan
A Table Scan means SQL Server is reading the table’s rows to find the required data.
Consider:
SELECT *
FROM Customers
WHERE City = 'Jaipur';
If there is no useful index on City, SQL Server may need to examine a large portion of the table.
For a small table, this may be perfectly reasonable.
For a table containing tens or hundreds of millions of rows, it can become expensive.
Example
Customers
│
├── Row 1
├── Row 2
├── Row 3
├── Row 4
├── ...
└── Row 10,000,000

        ↓

     Table Scan
        ↓
   Find matching rows
Is a Table Scan always bad?
No.
If the query needs most of the table’s rows, scanning the table can be more efficient than performing thousands or millions of individual lookups.
The important question is:
Is the scan appropriate for the amount of data the query needs?
2. Index Seek
An Index Seek allows SQL Server to navigate directly to relevant portions of an index.
For example:
CREATE INDEX IX_Customers_City
ON Customers(City);
Then:
SELECT
    CustomerId,
    CustomerName
FROM Customers
WHERE City = 'Jaipur';
may use the index efficiently.
Conceptually:
Without useful index:

10,000,000 rows
       ↓
 Table Scan
       ↓
Find Jaipur


With suitable index:

Index
  ↓
Seek to Jaipur
  ↓
Read matching rows
For highly selective queries, an index seek can dramatically reduce the amount of data SQL Server needs to examine.
But remember
An Index Seek isn’t automatically better than every other access method.
If a query needs a very large percentage of the table, a scan may still be the optimal strategy.
Table Scan vs Index Seek
| Operation | Typical Behavior | Potential Use |
|---|---|---|
| Table Scan | Reads table data broadly | Small tables or queries needing most rows |
| Index Seek | Navigates directly to matching index ranges | Selective queries |
| Index Scan | Reads an index broadly | Queries needing many rows or certain access patterns |
The correct choice depends on the query and workload.
3. Key Lookup
A Key Lookup occurs when SQL Server uses a non-clustered index to locate matching rows but then needs to retrieve additional columns from the underlying table or clustered index.
Consider:
SELECT
    CustomerId,
    CustomerName,
    Email,
    Phone
FROM Customers
WHERE City = 'Jaipur';
Suppose the index contains:
Citybut the query also requires:
CustomerName
Email
Phone
SQL Server may perform:
Index Seek
     ↓
Matching rows
     ↓
Key Lookup
     ↓
Retrieve additional columns
A small number of key lookups may be completely acceptable.
But if the query returns hundreds of thousands of rows, repeated lookups can become expensive.
How to Reduce Expensive Key Lookups
A carefully designed covering index can sometimes help.
For example:
CREATE INDEX IX_Customers_City
ON Customers(City)
INCLUDE
(
    CustomerName,
    Email,
    Phone
);
Now the index contains the columns needed by the query.
The optimizer may be able to satisfy the query directly from the index.
However, don’t automatically add every selected column to an index. Larger indexes increase storage and maintenance costs.
4. Hash Match
A Hash Match is an execution-plan operator commonly used for joins, grouping, or set operations.
For example:
SELECT
    c.CustomerName,
    o.OrderId
FROM Customers c
INNER JOIN Orders o
    ON c.CustomerId = o.CustomerId;
SQL Server may choose a hash-based strategy when it estimates that it will be efficient for the amount of data involved.
Conceptually:
Customers
   ↓
Build Hash Table
   ↓
Hash Match
   ↑
Orders
   ↓
Matching rows
Hash Match can be perfectly normal.
However, expensive hash operations can become a concern when:
- Large datasets are processed
- Cardinality estimates are incorrect
- Memory grants are insufficient
- Queries spill to TempDB
- The query processes more data than necessary
Hash Match and TempDB Spills
One important warning to look for is a spill.
If SQL Server doesn’t have enough memory for an operation such as a hash or sort, it may need to use TempDB.
Conceptually:
Query
 ↓
Hash Operation
 ↓
Not enough memory
 ↓
TempDB Spill
 ↓
Additional I/O
 ↓
Slower query
Execution-plan warnings can help identify these problems.
When you see a spill, investigate:
- Cardinality estimates
- Memory grants
- Query design
- Statistics
- Data volume
- Available memory
5. Nested Loops
Nested Loops is a common JOIN operator.
Conceptually:
Outer Table
    ↓
Row 1 ──→ Search Inner Table
Row 2 ──→ Search Inner Table
Row 3 ──→ Search Inner Table
...
Nested Loops can be extremely efficient when:
- The outer input is small
- The inner input has an efficient index
- The join is selective
For example:
10 customers
     ↓
10 indexed searches
     ↓
Orders
This can be very efficient.
But if SQL Server processes:
5,000,000 outer rowsand performs an expensive operation for each row, the same strategy can become extremely expensive.
Nested Loops vs Hash Match
The optimizer chooses a join strategy based on its estimates and available options.
Nested Loops
Often useful for:
- Smaller outer inputs
- Selective queries
- Indexed lookups
Hash Match
Often useful for:
- Larger datasets
- Equality joins
- Inputs where hashing is estimated to be efficient
Merge Join
Can be highly efficient when both inputs are already appropriately ordered.
There is no universally “best” join operator.
The goal is to determine whether the selected operator is appropriate for the actual workload.
6. Sort Operations
Sort operations can consume significant CPU and memory.
Consider:
SELECT
    OrderId,
    CustomerId,
    OrderDate
FROM Orders
ORDER BY OrderDate DESC;
SQL Server may need to sort a large number of rows.
Conceptually:
Millions of rows
       ↓
     SORT
       ↓
Ordered result
Sorting millions of rows can require substantial resources.
How can indexes help?
Suppose your workload frequently executes:
WHERE CustomerId = 1001
ORDER BY OrderDate DESC
An index such as:
CREATE INDEX IX_Orders_Customer_OrderDate
ON Orders(CustomerId, OrderDate DESC);
may allow SQL Server to access rows in a useful order.
Whether the sort is actually eliminated or reduced depends on the query and execution plan.
7. Reading Execution-Plan Costs
Execution plans display estimated operator costs.
These costs can help you understand which operations the optimizer considers expensive relative to the rest of the plan.
For example:
Index Seek       5%
Nested Loops    10%
Key Lookup      15%
Sort            70%
At first glance, the Sort looks like the obvious bottleneck.
But don’t blindly optimize the operator with the highest percentage.
Why?
The percentages are optimizer estimates, not a direct measurement of elapsed time.
They are useful clues, not absolute performance measurements.
Always combine cost information with:
- Actual row counts
- Logical reads
- CPU time
- Duration
- Wait statistics
- Execution frequency
- Runtime warnings
8. Estimated Cost vs Actual Performance
Suppose SQL Server estimates:
Operator A = 80%
Operator B = 20%
It does not necessarily mean Operator A consumed 80% of your actual CPU or elapsed time.
Execution-plan costs are primarily used by the optimizer to compare possible plans.
For real-world performance tuning, measure the query.
Use:
SET STATISTICS TIME ON;
SET STATISTICS IO ON;
Then execute the query and compare:
- CPU time
- Elapsed time
- Logical reads
- Logical writes
This gives you actual runtime evidence.
9. Estimated Rows vs Actual Rows
This is one of the most useful areas to inspect.
Imagine an operator shows:
Estimated Rows: 50
Actual Rows:    750,000
That is a significant discrepancy.
Why does it matter?
SQL Server uses row estimates to choose:
- Join algorithms
- Index access methods
- Memory grants
- Sort strategies
- Parallelism
If the estimates are significantly wrong, the optimizer may choose a poor plan.
Potential causes
- Outdated statistics
- Data skew
- Complex predicates
- Parameter sensitivity
- Correlated columns
- Query transformations
10. Execution Plan Warnings
Execution plans can contain warnings that deserve investigation.
Examples include:
- Missing indexes
- Spill warnings
- Implicit conversions
- Excessive memory grants
- Cardinality issues
Implicit conversions
For example, if one JOIN column is:
INTand another is:
VARCHARSQL Server may need to perform conversions.
This can affect performance and, depending on the expression and data types, can interfere with efficient index usage.
Ideally, related columns should use compatible data types.
11. Missing Index Recommendations
SQL Server may identify potential missing indexes in execution plans.
For example:
Missing Index

CREATE INDEX ...
ON Orders(CustomerId)
INCLUDE(OrderDate, TotalAmount)
This can be a useful starting point.
But don’t automatically create every suggested index.
Before creating one, ask:
- Does a similar index already exist?
- How frequently is this query executed?
- How expensive is the query?
- Is the table write-heavy?
- Will the new index increase storage significantly?
- Does the index benefit multiple queries?
Execution-plan recommendations should be treated as evidence for investigation, not automatic production changes.
12. Reading a Complete Execution Plan
Let’s consider a simplified query:
SELECT
    c.CustomerName,
    o.OrderDate,
    o.TotalAmount
FROM Customers c
INNER JOIN Orders o
    ON c.CustomerId = o.CustomerId
WHERE c.City = 'Jaipur'
ORDER BY o.OrderDate DESC;
A possible plan could look like:
Customers
   ↓
Index Seek
   ↓
Nested Loops
   ↑
Orders
   ↓
Index Seek
   ↓
Sort
   ↓
Result
Now ask:
Question 1
Is the Customer index selective?
Question 2
Is the Orders access method efficient?
Question 3
Is Nested Loops processing a reasonable number of rows?
Question 4
Why is a Sort required?
Question 5
Can an index support the filtering and ordering?
Question 6
Are estimated and actual row counts similar?
This is how you move from looking at a plan to diagnosing a performance bottleneck.
13. A Practical Execution Plan Troubleshooting Process
When you find a slow query, follow this sequence.
Step 1: Capture the Actual Execution Plan
Don’t rely only on estimated cost.
Step 2: Identify Expensive Operators
Look for:
- Scans
- Lookups
- Sorts
- Hash operations
- Large joins
Step 3: Check Actual vs Estimated Rows
Look for significant discrepancies.
Step 4: Check Warnings
Investigate:
- Spills
- Conversions
- Missing indexes
- Memory issues
Step 5: Check Logical Reads
Use:
SET STATISTICS IO ON;Step 6: Check CPU and Duration
Use:
SET STATISTICS TIME ON;Step 7: Review Indexes
Check:
- Existing indexes
- Index key order
- Included columns
- Duplicate indexes
- Missing indexes
Step 8: Test an Optimization
Change one thing at a time.
Step 9: Compare Before and After
Measure:
Before
CPU:       2,000 ms
Reads:     150,000
Duration:  2,500 ms

After
CPU:         250 ms
Reads:       12,000
Duration:    320 ms
Step 10: Monitor It Over Time
A query that is fast today can become slow after the database grows.
Common Execution Plan Mistakes
Mistake 1: Assuming Table Scan Is Always Bad
A scan can be appropriate for queries returning a large percentage of a table.
Mistake 2: Assuming Index Seek Is Always Good
A seek followed by millions of lookups can still be expensive.
Mistake 3: Trusting Cost Percentages Blindly
Estimated costs are useful for comparison but are not actual runtime measurements.
Mistake 4: Ignoring Actual Row Counts
Large estimation errors can explain poor plan choices.
Mistake 5: Creating Every Missing Index
Missing-index suggestions need workload-level validation.
Mistake 6: Ignoring Sort and Hash Warnings
Spills can introduce significant TempDB I/O.
Mistake 7: Optimizing Without Measuring
Always compare performance before and after.
Related SQL Server Performance Tuning Guides
For deeper troubleshooting, continue with these related SQL Server guides:
- Database performance optimization — common causes of slow databases and practical optimization ideas.
- SQL Server indexing — how to design indexes for better query performance.
- SQL Server blocking — identify and troubleshoot blocking queries.
- SQL Server parameter sniffing — understand plan sensitivity and troubleshooting approaches.
- TempDB contention — diagnose allocation contention and PAGELATCH waits.
How DBPulse Helps Identify Database Performance Bottlenecks
Execution plans are extremely powerful, but manually investigating database performance can become difficult when you manage multiple production databases.
This is where DBPulse can complement traditional SQL Server tools.
DBPulse — AI-Powered Database Monitoring provides centralized database monitoring, real-time query performance analysis, AI-based anomaly detection, and optimization-oriented insights. The platform currently advertises monitoring across SQL, NoSQL, cloud, and hybrid environments.
DBPulse’s documented workflow is:
Connect → Discover → Analyze → Optimize
It can surface slow queries, anomalies, lock waits, and capacity risks, and provides recommendations intended to help tune indexes, queries, and concurrency.
What can DBPulse help you identify?
- Slow queries
- Query latency
- CPU-related performance issues
- Lock waits
- Deadlocks
- Performance anomalies
- Workload trends
- Capacity risks
- Query optimization opportunities
- Index optimization opportunities
The official site currently advertises a 30-day free trial with no credit card required.
SQL Server Performance Tuning: Execution Plans + Monitoring
Execution plans answer:
How is SQL Server executing this query?
Monitoring answers:
When is the query becoming slow, how often does it happen, and what else is happening in the database at the same time?
Combining both creates a stronger troubleshooting workflow.
Database Monitoring
        ↓
Detect Slow Query
        ↓
Analyze Query Metrics
        ↓
Open Execution Plan
        ↓
Identify Bottleneck
        ↓
Optimize Query / Index
        ↓
Measure Improvement
        ↓
Continue Monitoring
This is much more effective than checking execution plans only after a production incident.
SQL Server Performance Tuning: Execution Plan Optimization Checklist
- Capture the actual execution plan
- Review estimated execution plan
- Compare estimated and actual rows
- Check Table Scans
- Check Index Scans
- Check Index Seeks
- Investigate expensive Key Lookups
- Review Hash Match operators
- Review Nested Loops
- Check Sort operations
- Check execution-plan warnings
- Check missing-index suggestions
- Review existing indexes
- Check implicit conversions
- Check TempDB spills
- Check logical reads
- Check CPU time
- Check elapsed time
- Check Query Store history
- Compare performance before and after optimization
- Continue monitoring after deployment
Frequently Asked Questions
What is a SQL Server execution plan?
A SQL Server execution plan shows the operations SQL Server uses to execute a query, including scans, seeks, joins, sorts, lookups, and other operators.
What is the difference between an estimated and actual execution plan?
An estimated plan shows what SQL Server expects to happen before execution. An actual plan includes runtime information from the query execution, including actual row counts.
Is a Table Scan always bad?
No. A Table Scan can be efficient when a query needs a large percentage of the table or when the table is small.
Is an Index Seek always better than a Table Scan?
No. An Index Seek can still be expensive if it returns many rows or causes a large number of Key Lookups.
What is a Key Lookup?
A Key Lookup occurs when SQL Server uses a non-clustered index to locate rows but needs to retrieve additional columns from the underlying table or clustered index.
What is Hash Match?
Hash Match is an execution-plan operator commonly used for joins, aggregation, and set operations. It can be efficient for larger inputs but may become expensive when large datasets or memory spills are involved.
What is Nested Loops?
Nested Loops is a join algorithm that repeatedly processes rows from one input against another input. It can be highly efficient when the outer input is small and the inner side has an efficient access path.
What do execution-plan costs mean?
Execution-plan costs are optimizer estimates used to compare operations and possible plans. They should not be treated as direct measurements of actual CPU or elapsed time.
How can I find a SQL Server performance bottleneck?
Start with the actual execution plan, then examine CPU, logical reads, duration, row estimates, waits, blocking, indexes, and Query Store history.
Conclusion
SQL Server execution plans are one of the most important tools for understanding database performance.
When you know how to interpret:
Table Scans → Index Seeks → Key Lookups → Hash Matches → Nested Loops → Sorts → Row Estimates → Execution Costs
you can move beyond simply saying:
“This query is slow.”
You can begin answering the more important question:
“Why is this query slow?”
Remember that no single execution-plan operator is automatically bad.
A Table Scan can be correct.
An Index Seek can be expensive.
A Nested Loop can be excellent.
A Hash Match can be appropriate.
The real goal is to understand whether the chosen plan is appropriate for the query, data volume, and workload.
The best performance-tuning process is:
Measure → Analyze → Optimize → Validate → Monitor.
For teams managing production databases, DBPulse adds continuous monitoring around this workflow by surfacing slow queries, anomalies, lock waits, capacity risks, and optimization opportunities.
Understand your execution plans. Find the bottleneck. Optimize with evidence



6 thoughts on “Complete SQL Server Performance Tuning Guide”