


How to Find Blocking Queries in SQL Server: Complete Guide to Diagnosing and Resolving SQL Blocking Issues
One of the most frustrating problems in SQL Server is when users complain that the application has suddenly become “slow,” yet CPU usage, memory consumption, and disk utilization all appear normal.
SQL Server blocking occurs when one session holds a lock while another session waits for the same resource. Learning how to find blocking queries in SQL Server helps you identify the head blocker, trace the blocking chain, and resolve slow queries, timeouts, and application performance problems.
Pages stop loading, reports freeze, API requests time out, and transactions remain in a “waiting” state. At first glance, nothing seems wrong with the server.
The hidden culprit is often SQL Server Blocking.
Blocking occurs when one transaction holds a lock on a resource while another transaction waits for that lock to be released. In busy production environments, a single long-running transaction can block hundreds of sessions, creating a chain reaction that impacts the entire application.
Unlike deadlocks, blocking is not an error. It is a normal part of SQL Server’s concurrency control. However, excessive blocking can dramatically reduce throughput, increase response times, and create the appearance of a system outage.
In this guide, you’ll learn how SQL Server locking works, how to identify blocking sessions using Dynamic Management Views (DMVs), how to trace the blocking chain to the root cause, and how to prevent blocking through proper database design and configuration.
Quick Answer: How to Find Blocking Queries in SQL Server
To find blocking queries in SQL Server, start with sys.dm_exec_requests and check blocking_session_id. Then identify the head blocker, retrieve its SQL text, inspect the transaction and wait information, and determine why the blocking session is holding locks for so long.
What Is SQL Server Blocking?
SQL Server uses locks to maintain data consistency.
Whenever a transaction reads or modifies data, SQL Server places locks on rows, pages, or tables.
Example:
User A starts:
BEGIN TRANSACTION;

UPDATE Accounts
SET Balance = Balance - 500
WHERE AccountID = 101;
Before User A commits the transaction:
COMMIT;
User B executes:
UPDATE Accounts
SET Balance = Balance + 200
WHERE AccountID = 101;
User B cannot modify the same row because User A still owns the exclusive lock.
User B waits.
This waiting is called Blocking.
Locking vs Blocking vs Deadlocking
Many administrators confuse these concepts.
| Feature | Locking | Blocking | Deadlock |
|---|---|---|---|
| Normal SQL Behavior | ✅ Yes | ✅ Yes | ❌ No |
| Waits for Resource | No | Yes | Yes |
| Automatically Resolved | Yes | Yes | SQL Server kills one session |
| Error Generated | No | No | Yes (1205) |
Blocking is expected.
Long blocking chains are not.
Common Causes of Blocking
Blocking usually occurs because of:
- Long-running transactions
- Large UPDATE statements
- DELETE operations
- Bulk imports
- Missing indexes
- Table scans
- Poor transaction design
- User interaction inside transactions
- Cursor-based processing
How Blocking Affects Applications
Imagine an online shopping platform.
One transaction updates inventory.
While that transaction remains open:
- Customers cannot place orders.
- Payment requests time out.
- Inventory reports stop updating.
- Checkout pages become slow.
One blocked session quickly becomes:
10 waiting sessions.
Then:
100 waiting sessions.
Eventually:
500+ blocked requests.
The application appears offline even though SQL Server is still running.
Symptoms of SQL Blocking
Common symptoms include:
- Application freezes
- Connection timeout errors
- Long-running queries
- High session waits
- Slow reports
- Login delays
- API response time increases
- Large number of sleeping transactions
How to Find Blocking Queries in SQL Server
The fastest way to identify blocking is by querying SQL Server Dynamic Management Views.
Run:
SELECT
    session_id,
    blocking_session_id,
    wait_type,
    wait_time,
    status,
    command
FROM sys.dm_exec_requests
WHERE blocking_session_id <> 0
ORDER BY blocking_session_id;
If rows are returned, blocking is occurring.
Identify the Head Blocking Session
Blocked sessions are only symptoms.
The real problem is the Head Blocker.
A head blocker is a session that:
- Blocks other sessions
- Is not itself blocked
Find it:
SELECT
    session_id,
    status,
    cpu_time,
    total_elapsed_time,
    command
FROM sys.dm_exec_requests
WHERE blocking_session_id = 0
AND session_id IN
(
SELECT blocking_session_id
FROM sys.dm_exec_requests
WHERE blocking_session_id <> 0
);
Always investigate the head blocker first.
View the SQL Statement Causing Blocking
Once you’ve identified the blocking session, retrieve the SQL statement.
SELECT
    r.session_id,
    s.login_name,
    s.host_name,
    st.text
FROM sys.dm_exec_requests r
JOIN sys.dm_exec_sessions s
ON r.session_id=s.session_id
CROSS APPLY sys.dm_exec_sql_text(r.sql_handle) st
WHERE r.session_id=52;
Replace 52 with the blocking session ID.
Visualize the Blocking Chain
Blocking often creates a chain.
Example:
Session 45
      │
      ▼
Session 60
      │
      ▼
Session 82
      │
      ▼
Session 103
Session 45 is the root blocker.
The remaining sessions are simply waiting.
Focus on the head blocker instead of terminating every blocked session.
Check Current Wait Types
Blocking sessions usually show waits such as:
SELECT
wait_type,
waiting_tasks_count,
wait_time_ms
FROM sys.dm_os_wait_stats
WHERE wait_type LIKE 'LCK%'
ORDER BY wait_time_ms DESC;
Common wait types include:
- LCK_M_S
- LCK_M_X
- LCK_M_U
Large values indicate lock contention.
Find Long-Running Transactions
Sometimes blocking occurs because transactions remain open too long.
Find active transactions:
SELECT
session_id,
status,
open_transaction_count,
last_request_start_time
FROM sys.dm_exec_sessions
WHERE open_transaction_count > 0;
Review transactions that remain open for extended periods.
Common Blocking Scenario
Bad:
BEGIN TRANSACTION;

UPDATE Orders
SET Status='Completed'
WHERE OrderID=500;

WAITFOR DELAY '00:05:00';

COMMIT;
The transaction keeps locks for five minutes.
Every user accessing that row waits.
Good:
UPDATE Orders
SET Status='Completed'
WHERE OrderID=500;
Keep transactions as short as possible.
Missing Indexes Can Increase Blocking
Without indexes:
UPDATE Orders
SET Status='Completed'
WHERE CustomerID=100;
SQL Server scans millions of rows.
Locks remain active longer.
Blocking increases.
After creating an index:
CREATE INDEX IX_Orders_CustomerID
ON Orders(CustomerID);
Updates complete faster.
Locks are released sooner.
Blocking decreases.
Reduce Blocking with READ COMMITTED SNAPSHOT (RCSI)
One of the most effective ways to reduce reader/writer blocking is enabling Read Committed Snapshot Isolation (RCSI).
Instead of reading locked rows, SQL Server reads row versions stored in TempDB.
Enable:
ALTER DATABASE SalesDB
SET READ_COMMITTED_SNAPSHOT ON;
Benefits include:
- Readers do not block writers.
- Writers do not block readers.
- Improved concurrency.
- Better application responsiveness.
Important: Test RCSI in a non-production environment before enabling it, as it increases TempDB usage and may affect application behavior.
Avoid User Interaction Inside Transactions
Bad:
BEGIN TRANSACTION

Update Database

Wait for User Confirmation

Commit
Locks remain active while the user decides.
Instead:
Get User Input

BEGIN TRANSACTION

Update Database

COMMIT
Only begin transactions when all required information is available.
Optimize Large Batch Operations
Instead of updating one million rows:
UPDATE Orders
SET Status='Closed';
Process batches.
UPDATE TOP (5000) Orders
SET Status='Closed';
Repeat until complete.
This reduces lock duration.
Best Practices to Prevent Blocking
- Keep transactions short.
- Create proper indexes.
- Avoid unnecessary table scans.
- Commit transactions immediately.
- Enable RCSI when appropriate.
- Process large updates in batches.
- Monitor lock waits regularly.
- Avoid user interaction inside transactions.
- Review execution plans for inefficient queries.
- Test concurrency under production-like workloads.
Monitoring Blocking with DBPulse
Blocking issues are often intermittent. A blocking chain may last only a few seconds before disappearing, making it difficult to diagnose manually using DMVs. By the time an administrator investigates, the evidence may already be gone.
DBPulse continuously monitors SQL Server activity and captures blocking events in real time, helping administrators identify the root cause before performance problems escalate.
With DBPulse, you can:
- Monitor active blocking sessions and blocking chains
- Automatically identify the head blocking session
- View the SQL statement causing the blockage
- Track lock wait statistics and blocking duration
- Receive real-time alerts for excessive blocking
- Correlate blocking events with application releases and workload spikes
- Analyze historical blocking trends to prevent recurring issues
- Monitor related performance metrics such as CPU, memory, TempDB, and query execution times from a unified dashboard
Instead of manually checking DMVs during production incidents, DBPulse provides continuous visibility into SQL Server concurrency issues, enabling faster troubleshooting and improved application availability.
Frequently Asked Questions
What causes blocking in SQL Server?
Blocking occurs when one session holds a lock on a resource while another session waits for that lock to be released.
How do I find the blocking query?
Query sys.dm_exec_requests to identify blocked sessions, then retrieve the SQL text for the blocking session using sys.dm_exec_sql_text.
What is a head blocker?
A head blocker is the session that blocks other sessions while not being blocked itself. Resolving the head blocker typically clears the entire blocking chain.
Does RCSI eliminate blocking?
RCSI significantly reduces reader/writer blocking, but it does not eliminate all forms of blocking, especially writer/writer conflicts.
Should I kill blocking sessions?
Only as a last resort. Always determine why the session is blocking others before terminating it, as killing the wrong session may roll back important business transactions.
Related SQL Server Performance Guides
- SQL Server Performance Tuning: How to Find and Fix Slow Queries
- SQL Server Execution Plans: Find and Fix Performance Bottlenecks
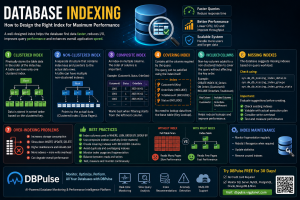
- Database Indexing: How to Design the Right Index for Maximum Performance
- SQL Server TempDB Allocation Contention: Diagnose and Fix PAGELATCH Waits
Conclusion
Blocking is a natural part of SQL Server’s locking mechanism, but excessive blocking can bring business-critical applications to a standstill. Long-running transactions, missing indexes, inefficient queries, and poor transaction design are among the most common causes.
By identifying the head blocking session, analyzing blocking chains, optimizing queries and indexes, shortening transaction duration, and considering concurrency features such as READ COMMITTED SNAPSHOT, database administrators can significantly improve application responsiveness and system scalability.
For production environments, continuous monitoring is essential. DBPulse helps organizations detect blocking in real time, visualize blocking chains, identify root causes, and receive proactive alerts—allowing teams to resolve concurrency issues before they affect end users and business operations.

2 thoughts on “How to Find Blocking Queries in SQL Server: Complete Guide”