


SQL Server TempDB Allocation Contention: Complete Guide to Diagnose and Fix PAGELATCH Waits
If your SQL Server suddenly becomes slow during peak business hours, reports take longer to complete, and users experience intermittent delays—even though CPU, memory, and disk utilization appear normal—the problem may not be your application or hardware.
One of the most common yet overlooked SQL Server performance bottlenecks is TempDB allocation contention.
TempDB is one of the busiest databases in SQL Server. It is used by almost every workload, including sorting, hashing, temporary tables, table variables, row versioning, index creation, and internal query processing. When multiple sessions attempt to allocate pages simultaneously, SQL Server can experience severe allocation bottlenecks.
The most recognizable symptoms are excessive PAGELATCH_UP and PAGELATCH_EX waits, which indicate contention on TempDB allocation pages such as PFS (Page Free Space), GAM (Global Allocation Map), and SGAM (Shared Global Allocation Map).
These waits can significantly reduce throughput, increase query response times, and impact overall application performance.
In this guide, you’ll learn how TempDB allocation contention occurs, how to diagnose it using Dynamic Management Views (DMVs), and the best practices to eliminate contention by configuring TempDB correctly.
SQL Server TempDB allocation contention can cause severe performance problems when many concurrent sessions compete for TempDB allocation pages. This guide explains how to diagnose PAGELATCH_UP and PAGELATCH_EX waits, verify TempDB contention, configure TempDB data files, and apply practical fixes to reduce allocation bottlenecks.
Quick Answer: How Do You Fix TempDB Allocation Contention?
To fix TempDB allocation contention, first confirm that PAGELATCH_UP or PAGELATCH_EX waits are associated with TempDB, then review TempDB data-file configuration, file sizes, growth settings, workload patterns, and version-store usage. A common starting point is multiple equally sized TempDB data files, followed by monitoring to determine whether additional changes are necessary.
What Is TempDB?
TempDB is a system database recreated every time SQL Server starts.
Unlike user databases, TempDB stores temporary objects and internal SQL Server operations.
It is heavily used for:
- Temporary tables (
#TempTables) - Table variables
- Sort operations
- Hash joins
- Row versioning
- Snapshot isolation
- Online index operations
- DBCC commands
- Index rebuilds
- Query spill operations
Because every database on the instance shares TempDB, it often becomes a performance bottleneck on busy servers.
What Is TempDB Allocation Contention?
Whenever SQL Server creates temporary objects, it must allocate new pages inside TempDB.
These allocations are managed through special system pages:
- PFS (Page Free Space) – Tracks free space on data pages.
- GAM (Global Allocation Map) – Tracks allocated extents.
- SGAM (Shared Global Allocation Map) – Tracks mixed extents.
When hundreds or thousands of concurrent sessions attempt to allocate pages simultaneously, they compete for access to these allocation pages.
This competition is called TempDB allocation contention.
Instead of processing queries, sessions wait for access to allocation pages, causing performance degradation.
Common Symptoms of TempDB Contention
You may be experiencing TempDB contention if you notice:
- High
PAGELATCH_UPwaits - High
PAGELATCH_EXwaits - Slow temporary table creation
- Increased query execution times
- Blocking without high disk activity
- CPU utilization lower than expected while users experience slow performance
- Performance degradation during reporting or ETL jobs
- Heavy waits on database ID 2 (TempDB)
Understanding PAGELATCH Wait Types
Unlike PAGEIOLATCH waits, which indicate disk I/O delays, PAGELATCH waits occur entirely in memory.
This means SQL Server is waiting for access to internal memory structures rather than physical storage.
Common latch waits include:
PAGELATCH_UP
Occurs when multiple sessions request update access to allocation pages.
PAGELATCH_EX
Occurs when exclusive access is required for page allocation.
Frequent waits on these types usually indicate TempDB allocation contention.
Identifying TempDB Allocation Waits
Use the following DMV query to identify the most significant latch waits.
SELECT
    wait_type,
    waiting_tasks_count,
    wait_time_ms,
    signal_wait_time_ms
FROM sys.dm_os_wait_stats
WHERE wait_type LIKE 'PAGELATCH%'
ORDER BY wait_time_ms DESC;
If PAGELATCH_UP or PAGELATCH_EX appear at the top of the results, investigate TempDB configuration.
Verify That Waits Are Occurring in TempDB
The following query displays sessions waiting on TempDB pages.
SELECT
    session_id,
    wait_type,
    wait_duration_ms,
    resource_description
FROM sys.dm_os_waiting_tasks
WHERE wait_type LIKE 'PAGELATCH%';
If the resource description references database ID 2, the contention is occurring in TempDB.
Check TempDB File Configuration
One of the first things every DBA should verify is the number and size of TempDB data files.
SELECT
    name,
    physical_name,
    size * 8 / 1024 AS SizeMB
FROM tempdb.sys.database_files;
Review:
- Number of data files
- File sizes
- Growth settings
Uneven file sizes can create allocation hotspots.
Why a Single TempDB File Causes Problems
Imagine a server with:
- 32 CPU cores
- Hundreds of concurrent users
- Thousands of temporary objects created every second
If TempDB has only one data file, every allocation request targets the same allocation pages.
This creates a bottleneck.
Multiple TempDB files distribute allocations across several allocation maps, reducing contention.
Best Practice: Configure Multiple TempDB Data Files
Microsoft recommends using multiple TempDB data files of equal size.
General guidance:
| Logical CPU Cores | Recommended TempDB Data Files |
|---|---|
| 1–4 | 1–4 |
| 8 | 8 |
| 16 | 8 |
| 32 | 8 (increase only if contention persists) |
| 64+ | 8–16 (monitor before adding more) |
Important: More files are not always better. Start with up to 8 equally sized data files, monitor performance, and increase only if contention continues.
Add Additional TempDB Files
Example:
ALTER DATABASE tempdb
ADD FILE
(
NAME = tempdev2,
FILENAME = 'D:\SQLData\tempdb2.ndf',
SIZE = 1024MB,
FILEGROWTH = 256MB
);
Repeat until the desired number of data files is configured.
Ensure all data files have:
- Equal initial size
- Equal growth settings
- Same storage performance characteristics
Configure Appropriate File Growth
Avoid percentage-based auto-growth.
Instead, use fixed increments.
Good example:
Initial Size: 4 GB
Growth: 512 MB
Avoid:
Growth: 10%
Percentage growth can create uneven file sizes over time.
Optimize Temporary Object Usage
Poor application design can overload TempDB.
Examples include:
- Large temporary tables
- Excessive table variables
- Unnecessary sorting
- Repeated cursor operations
- Large hash joins
Review application code to minimize unnecessary TempDB usage.
Monitor Version Store Usage
Snapshot isolation and Read Committed Snapshot Isolation (RCSI) use TempDB extensively.
Monitor version store space.
SELECT
    SUM(version_store_reserved_page_count) * 8 AS VersionStoreKB
FROM sys.dm_db_file_space_usage;
Unexpected growth may indicate long-running transactions.
Trace Flags and Modern SQL Server Versions
Historically, SQL Server administrators enabled trace flags such as:
- 1117
- 1118
These trace flags reduced allocation contention by changing extent allocation behavior.
SQL Server 2016 and later include these improvements by default, so manually enabling these trace flags is generally not required.
For older SQL Server versions, consult Microsoft’s guidance before enabling trace flags in production.
Monitor TempDB Space Usage
Use this query to check current TempDB allocation.
SELECT
    SUM(user_object_reserved_page_count) * 8 AS UserObjectsKB,
    SUM(internal_object_reserved_page_count) * 8 AS InternalObjectsKB,
    SUM(version_store_reserved_page_count) * 8 AS VersionStoreKB,
    SUM(unallocated_extent_page_count) * 8 AS FreeSpaceKB
FROM sys.dm_db_file_space_usage;
This helps identify excessive TempDB consumption.
Best Practices for Preventing TempDB Contention
- Configure multiple equally sized TempDB data files.
- Place TempDB on fast storage.
- Use fixed auto-growth increments.
- Monitor PAGELATCH waits regularly.
- Minimize unnecessary temporary object creation.
- Keep SQL Server updated with the latest cumulative updates.
- Review execution plans for excessive sorts and hash operations.
- Monitor version store growth.
- Test configuration changes before applying them in production.
Monitoring TempDB Health with DBPulse
TempDB allocation contention often develops gradually and is difficult to detect before users experience slow performance. Waiting until applications begin timing out can lead to extended troubleshooting and unnecessary downtime.
DBPulse continuously monitors SQL Server performance and provides real-time visibility into TempDB health, helping database administrators detect allocation bottlenecks before they become critical.
With DBPulse, you can:
- Monitor TempDB utilization in real time
- Track
PAGELATCH_UPandPAGELATCH_EXwaits - Identify sessions generating excessive TempDB activity
- Monitor query spills, sorts, and hash operations
- Track file growth and storage utilization
- Receive alerts when wait statistics exceed normal thresholds
- Analyze historical performance trends for proactive capacity planning
- Correlate TempDB issues with workload spikes and application releases
Instead of manually checking DMVs during a performance incident, DBPulse provides continuous monitoring and actionable insights, enabling faster diagnosis and long-term optimization of TempDB performance.
Frequently Asked Questions
What causes TempDB allocation contention?
It occurs when many concurrent sessions compete for TempDB allocation pages such as PFS, GAM, and SGAM while creating temporary objects or performing internal SQL Server operations.
What is the difference between PAGELATCH and PAGEIOLATCH?
PAGELATCH waits occur in memory and indicate contention for internal pages. PAGEIOLATCH waits indicate delays while reading data from disk.
How many TempDB files should I create?
A common starting point is up to 8 equally sized data files, depending on CPU count and workload. Add more only if monitoring confirms ongoing contention.
Are trace flags 1117 and 1118 still required?
For SQL Server 2016 and later, their behavior is largely built into the product. They are primarily relevant to older SQL Server versions.
How can I tell if TempDB contention is affecting my server?
Look for high PAGELATCH_UP or PAGELATCH_EX waits on database ID 2, along with slow query performance and heavy TempDB usage.
Related SQL Server Performance Guides
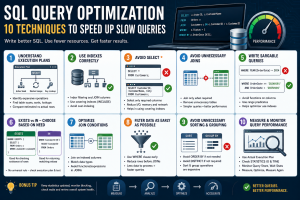
- SQL Server Performance Tuning: How to Find and Fix Slow Queries — troubleshoot slow queries using execution plans, waits, Query Store, and performance metrics.
- SQL Server Execution Plans and Performance Bottlenecks — understand execution plans and identify query-level bottlenecks.
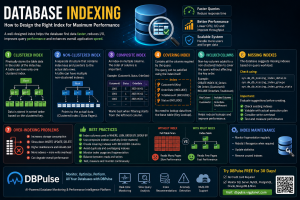
- Database Indexing: How to Design the Right Index for Maximum Performance — review indexing strategies that can reduce unnecessary query work.
- How to Find Blocking Queries in SQL Server — diagnose blocking alongside wait statistics when investigating database performance.
- Complete SQL Server Performance Tuning Guide
Conclusion
TempDB allocation contention is one of the most common causes of performance degradation in high-concurrency SQL Server environments. Excessive PAGELATCH_UP and PAGELATCH_EX waits indicate contention for allocation pages, preventing SQL Server from processing workloads efficiently.
By configuring multiple equally sized TempDB data files, monitoring latch waits, optimizing application design, and following Microsoft’s recommended TempDB best practices, organizations can significantly improve throughput and reduce query latency.
For proactive database administration, continuous monitoring is essential. DBPulse helps database teams monitor TempDB usage, detect allocation contention, analyze wait statistics, and receive real-time alerts—making it easier to resolve performance issues before they impact business-critical applications.

I am now not positive where you’re getting your info,
however good topic. I must spend some time learning more or understanding more.
Thanks for excellent information I was searching for this info
for my mission.